-- #china GDP did more than 100% for Shanghai index
-- Bubbles in Dow come more from #markets sensitivity to cheapness of money than cheap #money
-- China's industrial capacity has supported increasing #sales volume but not profitability
-- The smart money has shorter duration
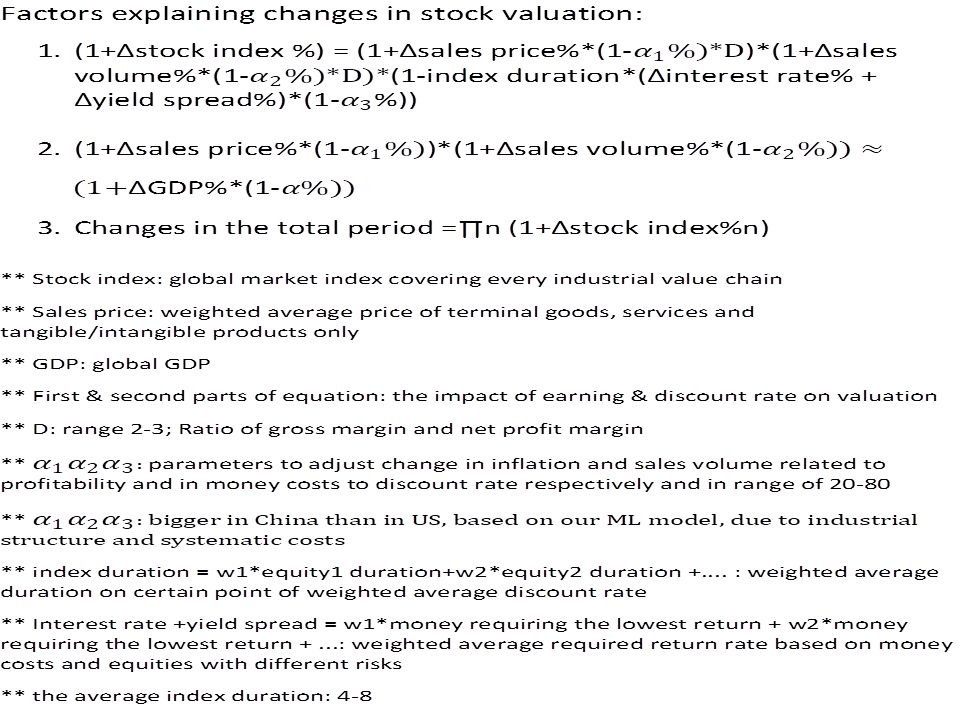
Price-driven growth (∆sales price%, equation1) presents not the company's earning but the entire industrial chain, which matches GDP. If we assume US GDP growth (2%) is driven 100% by inflation, US companies account for 80+% of price-driven profit on the chain, and the ratio D is 3, GDP growth can explain ¼ of 300% increase in Dow index (2009-2021) >>> (1+2%*80%*3)^(12)-1=80%. Another 200% index boom is related to the QE, tax, and the duration of market to the policies.
Correspondingly, if the numbers, as assumed above, for China are 7% (GDP), 30% (from inflation), and 20% (companies profits), the price-driven part of GDP growth explained ¼ of 80% increase in Shanghai index (2009-2021) >>> (1+7%*1/3*20%*3)^(12)-1= 19%. The remaining must be attributable to the volume-driven part of GDP and leave no role for its CB policy because a2 (equation1) is already set as high as 65%.

