Our relative valuation, involving multiples with current price and 12 months trailing cash flows, presents a method making it possible to quickly and massively evaluate companies across industries and sectors, which is the core part supporting our economy research and trading strategy.
We firstly want to look at a company from the angle of investors. The return for an investor of the equity of a company should be what cash inflow we can gain after we purchase stocks of a company. The simplest but efficient method to measure an investment is the current multiples: 1. Enterprise price/EBI 2. Equity price/cash inflow.
If we assume that all companies will be running at current conditions (constant sales, margins, tax rates, and debt ratios), for some certain moment, the multiples for all companies should be equal otherwise investors will pursue those companies who have higher returns that present lower multiples and thus push up the stocks’ price and multiples.
However, apparently the market knows that the assumption is not true. In fact, the potential chances/risks resulted from deviation from their current operating condition are always being discounted in the prices and thus in the multiples. In the following, you will see what those chances/ricks are and how they, which are hidden in equations, determine multiples.
Multiples of price and cash inflow - Relativity of stock price and value of business:
- Cash and terminal value
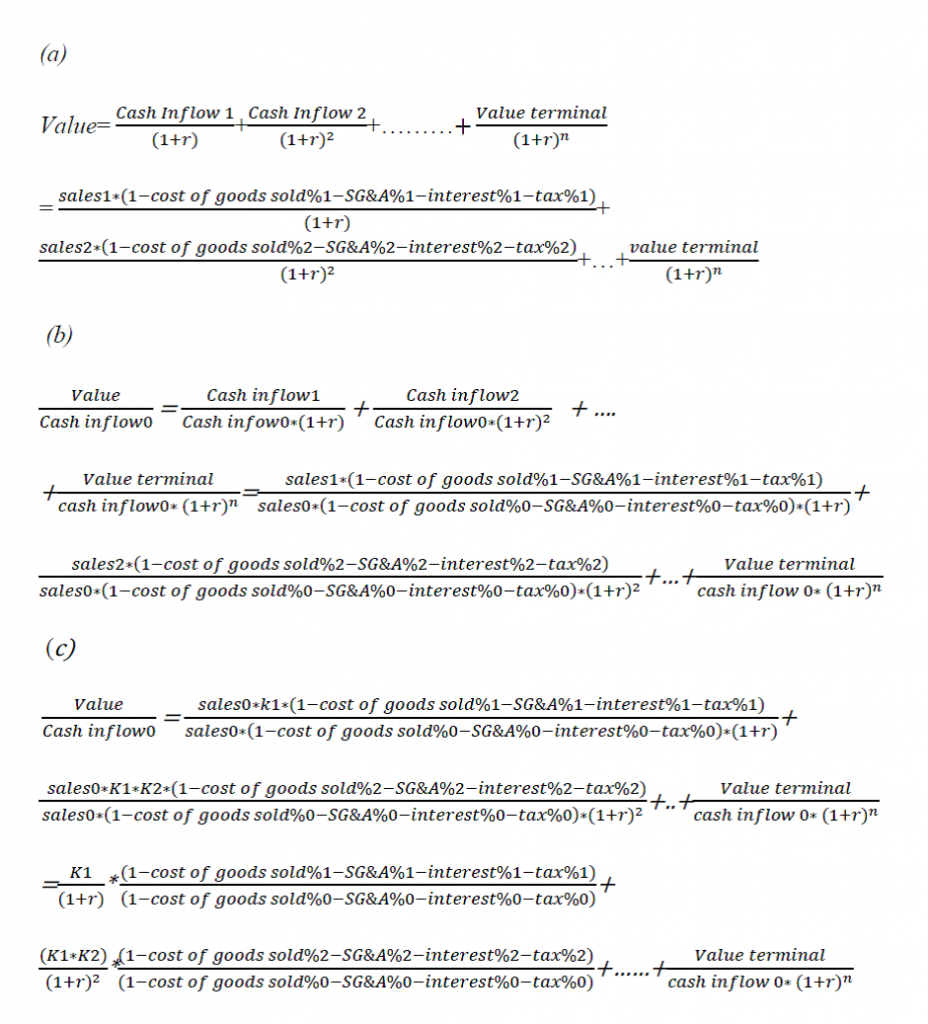
Value of business should be the sum of present values of all cash inflows that it will generate in different periods of times in future. The value of business we defined here is the value that the asset of business excluding cash on hand, will generate. Cash, as a part of terminal value, present its current value and is significant when added into model. Therefore, if the company had a large amount of cashes on hand on the date we value it we will remove it from market capital before calculate the multiples.
- The cash inflow of a business is defined as
Cash inflow=sales-sales*cost of goods sold% - sales*SG&A%+sales*depreciation%-sales*interest%-sales*tax%-sales*depreciation%=sales*(1-cost of goods sold%-SG&A-interest%-tax%)
- Theoretical proving
- About sales and its estimate
If all changes in external sales-related factors exert the same influence on sales of companies who provide same products and service for similar target consumers or similar consumers, then we can say, at the moment of time0, sales1=sales0*K, sales2=sales1*K1=sales0*K1*K2…….., sales N =sales0*K1K2…KN and K1,K2….KN are applied for all companies in the sector.( we assume that time’s relativity theory works, which means that when we say about the value of a company we refer only to the value at some certain moment after we consider all internal changes inside business and before any new internal changes happen. If any internal changes happened, estimate should be reset with new sales and cash inflow numbers. Therefore, a periodic reset is required with our valuation of relativity.
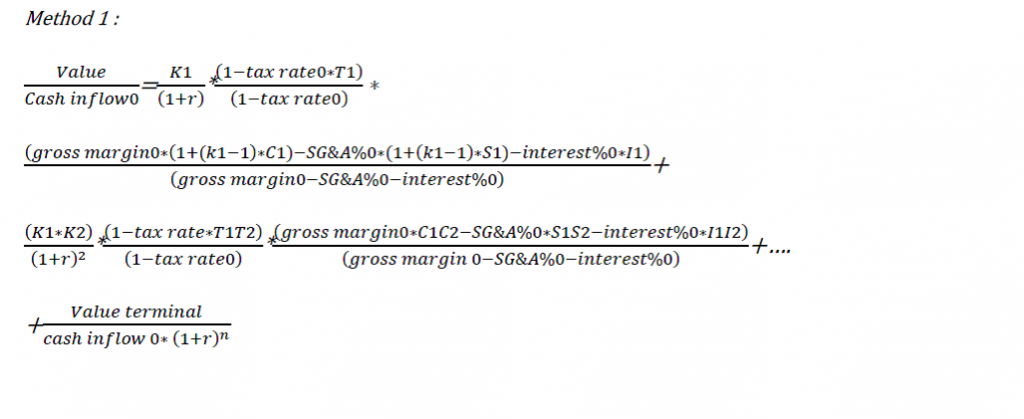
- About cost of goods sold%, SG&A%, and interest%
Yearly changes in cost of goods sold% and SG&A% are different and should be considered in comparing the multiples. Most of external factor that are related to them should have similar impact on them except for sales number. The level of sales is the key to compare the difference in changes of those two parameters when sales change. If any changes happened caused by internal company, relativity should be reset to start new comparison. Interest% should be consistent for certain period of time for a certain company and any unusual changes should trigger a reset of comparison.
- About tax% and their changes
Tax/sales=sales*(1-cost of goods sold%-SG&A%-interest %)*tax rate/sales= (1-cost of goods sold%-SG&A%-interest %)*tax rate. Tax rate is also related to sales level.
- About r
Internal return rate –r is different for different company and should be determined primarily by debt level.
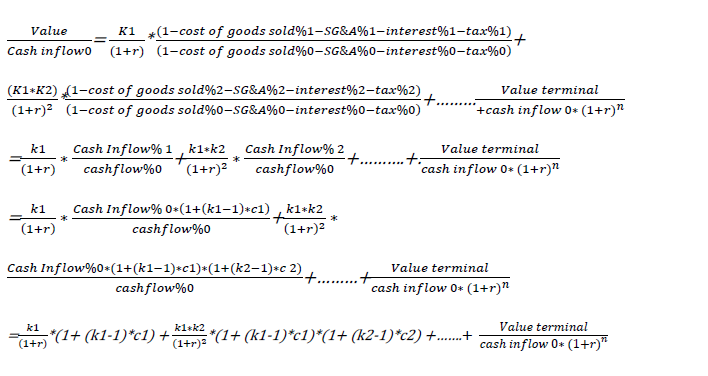
Conclusion
It seems that price / cash inflow multiples of companies in the same sector should swing in a very narrow range since K1,K2,….KN are similar. As we can see above, the parameters such as T,C,S, I and r determine the range of the multiples for the same sector companies. And the r, the internal return rate seems exerting larger impact than other factors. With the historical T,C,S, I and r we should be able to estimate the size of the range for any sector. Therefore, if multiples calculated by real time stock price fall outside the range or in wrong places in the range it may be a signal that the stock price is shifting away from its value relatively compared with another one in the sector.
We can see from the formula above that, only when Tn=1,Cn=0 and Sn=0 ( which mean that gross margin and SG&A% have no change and Tax rate has no changes), multiple of companies are equal. Otherwise, multiple will be different and the smaller the Cn and Sn are, the narrower the multiples span.
Comparing multiples:
When r is close to each other (determined by debt/asset ratio/ if r is different, compare debt and liquidity of cash) and when k1 is the same in the same sector and similar market (if Kn is different, compare industry and sector future):
If k1>1(revenue increases) then the bigger c1 is and the smaller s1 is and the bigger the multiple should be;
If k1<1 (revenue decreases) then the smaller the c1 is and the bigger s1 is and the bigger the multiple should be.
Because we do not know Kn >1 or <1, only when the historical data meet both two rules above we can only tell which multiple is bigger.
Method 2:
Comparing multiples:
When r is close to each other determined by debt/asset ratio and When k1 is the same in the same sector and similar market:
If k1>1 (revenue increases) then the bigger c1 is and the bigger the multiple should be;
If k1<1 (revenue decreases) then the smaller the c1 is and the bigger the multiple should be.
Because we do not know Kn >1 or <1, only when the historical data meet both two rules above we can determine which multiple is bigger.
Multiples of price and sales
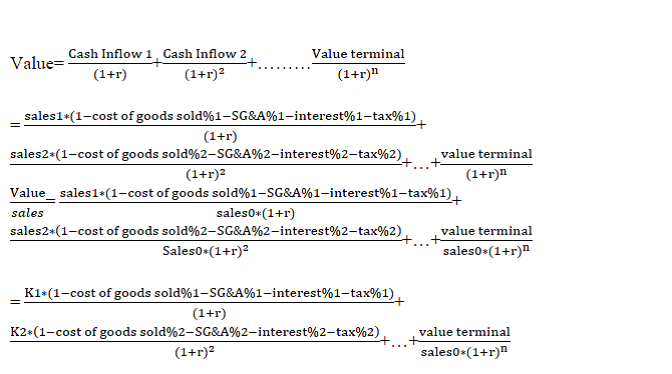
Conclusion
Compared with multiple of price and cash inflow we can see gross margin and SG&A% much more direct impact on the multiples. Roughly we can say multiple1/multiple2 >> (gross margin1 –SG&A%1)/ (gross margin2 –SG&A%2)
